
Page 60 - MetalForming July 2012
P. 60
The Science of Forming
By Stuart Keeler
Using an Ultrasonic Thickness Gauge to Solve Forming Problems
Last month we covered troubleshooting with statistical deformation control (SDC). This process uses standard control charts and forming-severity measurements (thickness strain) to assess the probability of splits. Using an ultrasonic-thickness gauge (UTG) permits rapid measure- ments without damaging the stampings.
Here I’ll present five case studies to illustrate a simple process for tracking forming problems with a UTG, without generating control charts. Rather, the stamper takes a series of UTG measurements and plots them against time until a pattern or signature of forming severity becomes evident. Similar to SDC, two locations are measured—the most severe, based on the forming-limit diagram, and one with zero deformation. These allow calculation of thickness strain (severity) without premeasuring initial blank thickness.
Case Study 1
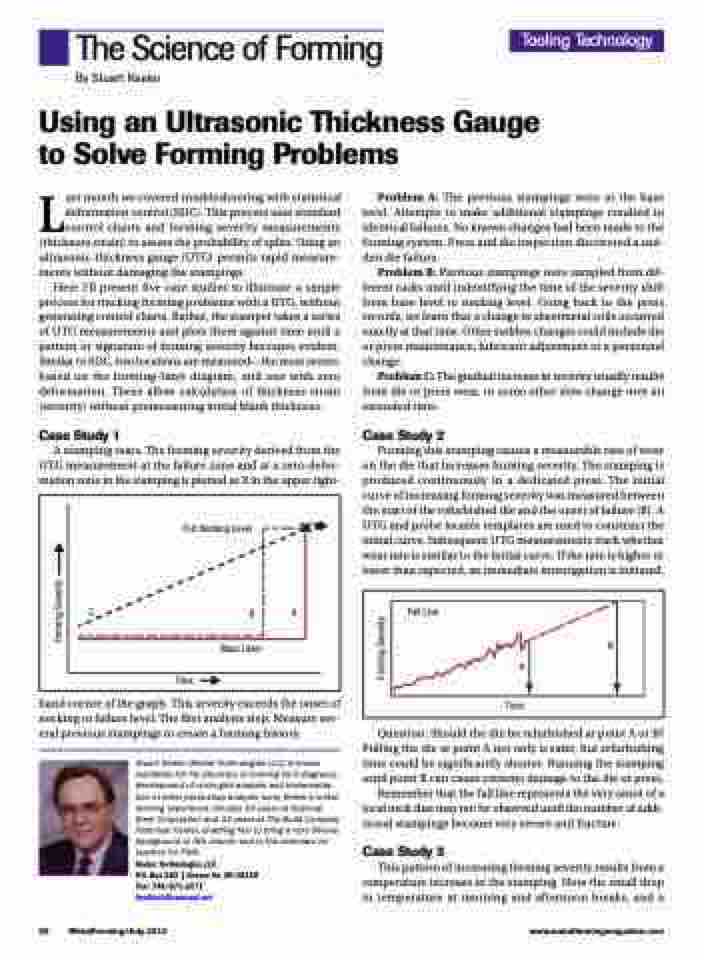
A stamping tears. The forming severity derived from the UTG measurement at the failure zone and at a zero-defor- mation zone in the stamping is plotted as X in the upper right-
Problem A: The previous stampings were at the base level. Attempts to make additional stampings resulted in identical failures. No known changes had been made to the forming system. Press and die inspection discovered a sud- den die failure.
Problem B: Previous stampings were sampled from dif- ferent racks until indentifying the time of the severity shift from base level to necking level. Going back to the press records, we learn that a change in sheetmetal coils occurred exactly at that time. Other sudden changes could include die or press maintenance, lubricant adjustment or a personnel change.
Problem C: The gradual increase in severity usually results from die or press wear, or some other slow change over an extended time.
Case Study 2
Forming this stamping causes a measurable rate of wear on the die that increases forming severity. The stamping is produced continuously in a dedicated press. The initial curve of increasing forming severity was measured between the start of the refurbished die and the onset of failure (B). A UTG and probe locater templates are used to construct the initial curve. Subsequent UTG measurements track whether wear rate is similar to the initial curve. If the rate is higher or lower than expected, an immediate investigation is initiated.
Tooling Technology
FLD Necking Level x
CBA Base Level
Time
Fail Line
Time
A
B
hand corner of the graph. This severity exceeds the onset of necking or failure level. The first analysis step: Measure sev- eral previous stampings to create a forming history.
Stuart Keeler (Keeler Technologies LLC) is known worldwide for his discovery of forming limit diagrams, development of circle-grid analysis and implementa- tion of other press-shop analysis tools. Keeler’s metal- forming experience includes 24 years at National Steel Corporation and 12 years at The Budd Company Technical Center, enabling him to bring a very diverse background to this column and to the seminars he teaches for PMA.
Keeler Technologies LLC
P.O. Box 283 | Grosse Ile, MI 48138 Fax: 734/671-2271 keeltech@comcast.net
Question: Should the die be refurbished at point A or B? Pulling the die at point A not only is safer, but refurbishing time could be significantly shorter. Running the stamping until point B can cause extreme damage to the die or press.
Remember that the fail line represents the very onset of a local neck that may not be observed until the number of addi- tional stampings become very severe and fracture.
Case Study 3
This pattern of increasing forming severity results from a temperature increase in the stamping. Note the small drop in temperature at morning and afternoon breaks, and a
58 MetalForming/July 2012
www.metalformingmagazine.com
Forming Severity
Forming Severity
