
Page 15 - MetalForming March 2012
P. 15
Best Practices
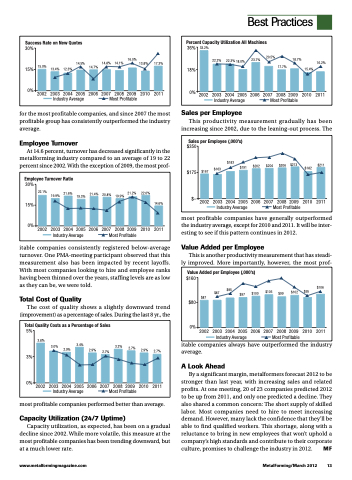
Success Rate on New Quotes
30%
16.0%
14.5% 14.8% 14.1% 13.8% 17.3%
15% 15.0% 13.4% 12.3% 14.7%
0%
2002 2003 2004 2005 2006 2007 2008 2009 2010 2011 Industry Average Most Profitable
Percent Capacity Utilization All Machines
36% 33.2%
18%
20.5%
22.2% 22.3% 18.0% 23.7% 18.7%
16.2%
17.7%
15.4%
0% 2002 2003 2004 2005 2006 2007 2008 2009 2010 2011 Industry Average Most Profitable
for the most profitable companies, and since 2007 the most profitable group has consistently outperformed the industry average.
Employee Turnover
At 14.6 percent, turnover has decreased significantly in the metalforming industry compared to an average of 19 to 22 percent since 2002. With the exception of 2009, the most prof-
Sales per Employee
This productivity measurement gradually has been increasing since 2002, due to the leaning-out process. The
Sales per Employee (,000’s)
$350
$175 $167
$–
$163
$191
$202 $204
$182
$183
$206 $213
$211
2002 2003 2004 2005 2006 2007 2008 2009 2010 2011 Industry Average Most Profitable
Employee Turnover Ratio
30%
15%
22.1% 21.6% 19.9%
19.3%
21.4% 20.8%
21.2% 22.0% 19.9%
0%
2002 2003 2004 2005 2006 2007 2008 2009 2010 2011
Industry Average Most Profitable
14.6%
itable companies consistently registered below-average turnover. One PMA-meeting participant observed that this measurement also has been impacted by recent layoffs. With most companies looking to hire and employee ranks having been thinned over the years, staffing levels are as low as they can be, we were told.
Total Cost of Quality
The cost of quality shows a slightly downward trend (improvement) as a percentage of sales. During the last 8 yr., the
most profitable companies have generally outperformed the industry average, except for 2010 and 2011. It will be inter- esting to see if this pattern continues in 2012.
Value Added per Employee
This is another productivity measurement that has steadi- ly improved. More importantly, however, the most prof-
Value Added per Employee (,000’s)
$160
$106
$87
$80
$95 $105 $87$97$100
$102 $95 $99
0%
2002 2003 2004 2005 2006 2007 2008 2009 2010 2011
Industry Average Most Profitable
Total Quality Costs as a Percentage of Sales
5%
3.8%
3%
0%
3.0% 3.4% 2.9%
2.9% 2.7%
3.2% 2.7%
2.9% 2.7%
2002 2003 2004 2005 2006 2007 2008 2009 2010 2011 Industry Average Most Profitable
most profitable companies performed better than average.
Capacity Utilization (24/7 Uptime)
Capacity utilization, as expected, has been on a gradual decline since 2002. While more volatile, this measure at the most profitable companies has been trending downward, but at a much lower rate.
itable companies always have outperformed the industry average.
A Look Ahead
By a significant margin, metalformers forecast 2012 to be stronger than last year, with increasing sales and related profits. At one meeting, 20 of 23 companies predicted 2012 to be up from 2011, and only one predicted a decline. They also shared a common concern: The short supply of skilled labor. Most companies need to hire to meet increasing demand. However, many lack the confidence that they’ll be able to find qualified workers. This shortage, along with a reluctance to bring in new employees that won’t uphold a company’s high standards and contribute to their corporate culture, promises to challenge the industry in 2012. MF
www.metalformingmagazine.com
MetalForming/March 2012 13
