
Page 33 - MetalForming December 2011
P. 33
Best Practices
By Bob Dobrowsky
Company Size and Operational Performance
This is the fourth article in our series presenting data from the 2010 PMA Benchmarking Report. As this arti- cle goes to print, the 2011 report is being compiled and will be released soon. This month, let’s take a look at the per- formance of two subsets of the metalforming industry: com- panies with more than 100 employees, and those smaller companies with fewer than 100 employees. The information
reported is based on the responses of 74 companies—45 with fewer than 100 employees and 29 with more than 100.
Is bigger better? The answer is, “It depends.” There are obvious advantages to both. Smaller companies oftentimes are more flexible and agile. Doug Tisch, sales manager for metal stamper Stamco Industries, which employs about 70, says: “We are flexible and can adapt quickly to the changing conditions. For instance, we transitioned from the tradi- tional five day per week schedule to four 10-hr. days.” Tisch goes on to say that, “This schedule benefits our employees while also keeping our focus on customer service.”
In comparison to smaller companies, larger firms typically operate with more structured systems and processes, using deeper resources throughout the organization.
In terms of operational performance, the results vary (Fig. 1). Smaller companies outperformed larger companies in certain areas, while larger companies did better in others, most notably in the area of profitability. Larger companies reported higher levels of earnings as measured by earnings before interest and taxes (EBIT) and earnings before interest, taxes, depreciation, and amortization (EBITDA).
Management Metrics
Where did companies with fewer than 100 employees perform better? Our survey finds small companies excel in the metrics relating to training, receivables turnover, success rate on new quotes and employee turnover.
For example, smaller companies invested more in their employees, spending 0.86 percent of total payroll dollars on training compared to 0.69 percent invested by larger com- panies. These same companies provided employees an addi- tional 4.0 hr. of training on an annual basis (29 hr. on aver- age, per employee) over what larger companies provided their employees
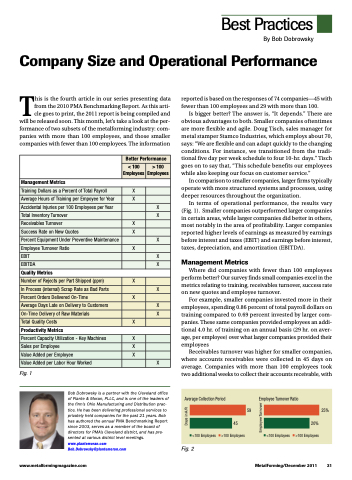
Receivables turnover was higher for smaller companies, where accounts receivables were collected in 45 days on average. Companies with more than 100 employees took two additional weeks to collect their accounts receivable, with
Better Performance
< 100 Employees
> 100 Employees
Management Metrics
Training Dollars as a Percent of Total Payroll
X
Average Hours of Training per Empoyee for Year
X
Accidental Injuries per 100 Employees per Year
X
Total Inventory Turnover
X
Receivables Turnover
X
Success Rate on New Quotes
X
Percent Equipment Under Preventive Maintenance
X
Employee Turnover Ratio
X
EBIT
X
EBITDA
X
Quality Metrics
Number of Rejects per Part Shipped (ppm)
X
In Process (internal) Scrap Rate as Bad Parts
X
Percent Orders Delivered On-Time
X
Average Days Late on Delivery to Customers
X
On-Time Delivery of Raw Materials
X
Total Quality Costs
X
Productivity Metrics
Percent Capacity Utilization - Key Machines
X
Sales per Employee
X
Value Added per Employee
X
Value Added per Labor Hour Worked
X
Fig. 1
Average Collection Period
45 <100 Employees >100 Employees
Employee Turnover Ratio
59
25%
<100 Employees
20% >100 Employees
www.metalformingmagazine.com
MetalForming/December 2011 31
Bob Dobrowsky is a partner with the Cleveland office of Plante & Moran, PLLC, and is one of the leaders of the firm’s Ohio Manufacturing and Distribution prac- tice. He has been delivering professional services to privately held companies for the past 21 years. Bob has authored the annual PMA Benchmarking Report since 2003, serves as a member of the board of directors for PMA’s Cleveland district, and has pre- sented at various district level meetings. www.plantemoran.com
Bob.Dobrowsky@plantemoran.com
Fig. 2
Days in A/R
Employee Turnover
