|
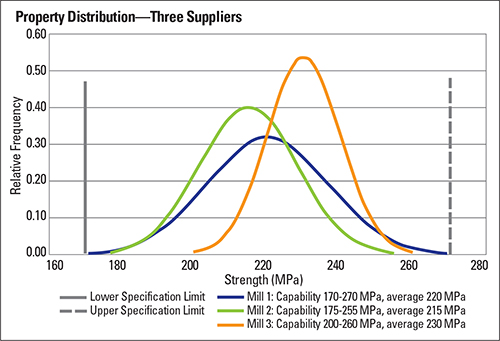
Fig. 2
|
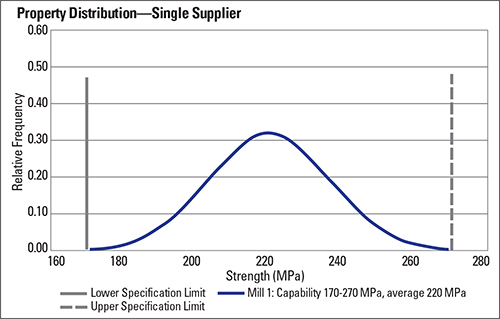
Similarly, consider sheetmetal production of a grade intended for a part requiring strength between 170 and 270 MPa, representing the lower and upper specification limits. That does not mean that production cannot result in strengths falling outside of this range—just that the product shipped to the customer must meet the range constraints. Fig. 1 depicts a supplier with a production capability that takes up the full range of allowable strength levels. This supplier’s approach satisfies the application needs, at least in terms of strength.
Each company uses different equipment and different process-control capabilities, which affect the property variability of shipped coils. Fig. 2 shows the property variability of three suppliers. All can satisfy the strength requirement. The average strength of the product shipped from mill 2 is lower than that from mill 3. Remember that lower strength commonly is associated with a more formable product. However, the parts manufacturing company still may prefer to receive sheetmetal from mill 3. Even though the material is stronger and probably less formable, it comes in a tighter range. With this reduction in incoming variability, the stamping plant may better control the parts it produces.
|
Fig. 3
|
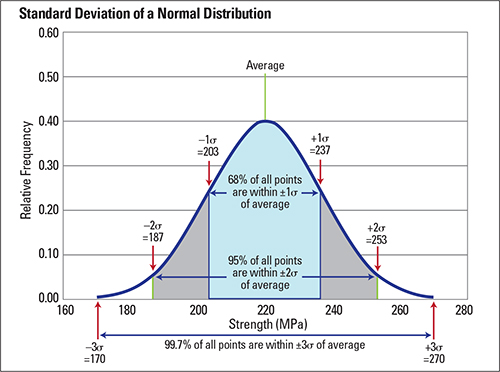
A mathematical term, standard deviation, describes this variability. This is represented by the lowercase Greek letter sigma, or s. Knowing the standard deviation lets you estimate the likelihood that any one test result will fall within tolerance, and its proximity to the average. Two-thirds of all test results will fall within one standard deviation of the average (Fig. 3), meaning that one-third of all test results will fall outside of this range. However, more than 95 percent of all results will fall within two standard deviations of the average value (average ±2sσ). A range of ±6sσ (six standard deviations) encompasses 99.73 percent of all results. This corresponds to a Process Capability Index, or Cpk, of 1.0. A Cpk of 1.33 is associated with readings within ±4sσ of average (63 out-of-compliance results for every one-million tests), while a Cpk of 1.67 corresponds to all readings falling within ±5sσ of average (one defect per one-million tests).
Tighter process controls will decrease the standard deviation. There may be valid reasons why your supplier is not implementing all steps to reduce variability when it already can meet the specified tolerances. For example, the alloying-element range in the melt specification likely is wide to enable production of several grades from that one set of chemistries. This allows for production efficiencies and provides for steady-state processing conditions that will improve process quality. Similarly, adjustments in the annealing temperature cannot be realized instantaneously in the furnace. Rapid changes bring a greater risk of undershooting or overshooting the targeted value, leading to a wider property variation in the finished product. MF
Learn about high-strength-steel grades and formability, tool steels and coatings, presses and die design, and effective lubricant strategies at PMA’s two-day Stamping Higher-Strength Steels Seminar in Nashville, TN, September 12-13. Visit www.pma.org for details and registration, or contact Marianne Sichi at msichi@pma.org for information.
See also: Engineering Quality Solutions, Inc., 4M Partners, LLC
Technologies: Quality Control


 Daniel Schaeffler