


 Stuart Keeler
More Conversations with Your Stamping
April 1, 2013Comments
A stamping is tearing in the first die, and you’re the assigned troubleshooter. To solve the problem, you first ask the folks in the toolroom if they have found a solution to a similar problem. You then brainstorm with others to create a list of possible solutions; take a stab at developing a correction procedure; and search for a solution by trial and error experimenting. Then you remember the team training received last year, which included developing a life-saving strategy for becoming stranded on a deserted island, lost in a deep jungle or some other similar experience. You have in your possession 10 items that can help save your life or increase your chance of rescue. Your assignment: to rate these items based on their level of importance. When completed, your list is graded against the “school solution.” In the next phase you join a team to discuss and rank the same 10 life-saving items. Not surprisingly, the team gets a higher score than any of the individual members.
Hoping for the same success with the tearing problem, you quickly form a troubleshooting team that includes the area manager, product engineer and process engineers, material and lubricant suppliers and tryout toolmaker. Unfortunately you forgot to invite one more member to join the team, someone present when the tearing took place, knew the condition of the stamping at failure and can help define the origin of the failure. Who is this great source of high-quality data that can easily be verified and converted into information? The torn stamping.
Speaking the Language
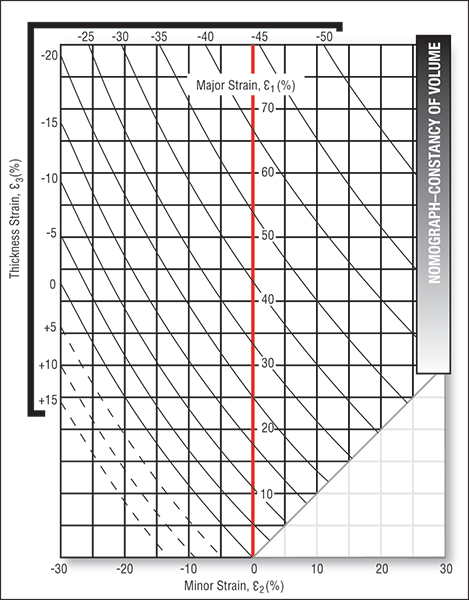 |
| Fig. 1—Nomograph replaces equations relating thickness strain to major and minor surface strains. If two of the strains are known, the third can be determined graphically. |
The first requirement for communicating with the stamping is having a common language—the most accepted is the circle grid. Other languages include thickness values from an ultrasonic thickness gage (UTG) or a laser thermometer gun. This permits you to ask different questions, which the stamping answers with usable data, such as: What was the magnitude and direction of the deformation at the failure site relative to its neighboring areas?
Next, the data must be converted to useful information. In this case, a forming-limit diagram (FLD) gets the call. While a standalone FLD will prove useful, we can glean even more information by constructing the FLD on a constancy-of-volume (COV) nomograph (Fig. 1). Forming reshapes the workpiece material, changing its length, width and thickness. To maintain a constant volume, two of these directions can change independently of the third. This third dimension (usually thickness) is required to balance the surface strains. For example, consider rolling out a sheet of baking dough. As length and width increase, thickness must decrease. While we can use an equation to calculate these changes, the COV nomograph proves faster and more visual when trying to understand the changes.
A circle etched into the surface of the sheetmetal deforms into an ellipse. The long axis of the ellipse represents the major strain plotted on the vertical (Y) axis of the graph in Fig. 1. The axis of the ellipse perpendicular to the major strain represents minor strain and is plotted on the horizontal (X) axis of the graph. The thickness strains are shown as the diagonal lines across the graph, with thinning and thickening values along the outside right and top edges. For example, at a deformation site with a 30-percent increase in major strain and a 10-percent increase in minor strain, the workpiece experiences a 30-percent thickness reduction.
Translating and Interpreting the Data
The FLD specifies the maximum amount of strain a given coil of material can withstand without failure for every combination of major and minor strains. Fig. 2 shows an FLD superimposed on the COV nomograph, for an FLC0 of 35 percent. For low-carbon steel this number is computed using sheet thickness and the work-hardening exponent (n-value) from a tensile test. Note the left side of the FLD contains lines of constant thinning.
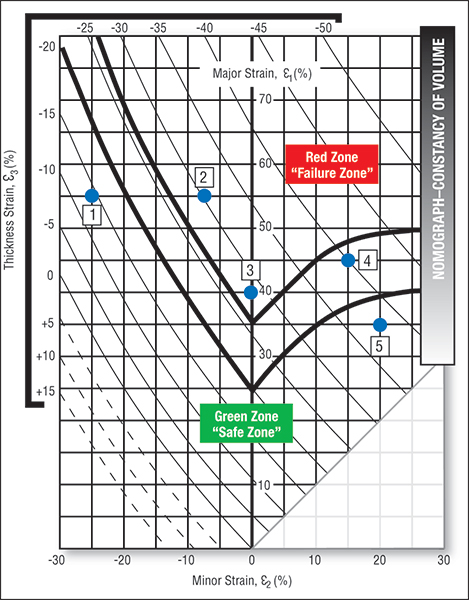 |
| Fig. 2—Superimposing the FLD on the constancy-of-volume curve improves the translation of data from the stamping into useful troubleshooting information. The zone between the green and red zones is the marginal or yellow safety zone. |
• Stamping 1: High major strains can be obtained when the minor strain is significantly negative. These negative minor strains indicate a strong compressive force in the minor direction, causing the material to expand (even extrude) in the major strain direction. While the accompanying major strain looks dangerously large, the resulting severity is in the green (safe) zone. A UTG can monitor stamping thickness at this point to look for increases in forming severity.
• Stamping 2: This stamping is in the red zone. Such severe conditions are best detected at initial die tryout when corrective actions prove most effective. A UTG can be used to track required reductions in major or minor strain values.
• Stamping 3: This common condition is in the red (failure) zone. The low values of major and minor strains do not give a visual sense of severe forming. When high major strains are detected on character lines, radii and other formations with zero minor strain, the reduction in severity is achieved only by reducing the major strain.
• Stamping 4: This strain combination approaches the top of the marginal zone, where process variations can easily push major strain into the red zone. While failures are not expected during die tryout, production speeds, increased die temperature, die wear and other process changes can easily cause production failures.
• Stamping 5: This stamping process is in the safe (green) zone and will form parts without tearing. However, the 38-percent thinning may interfere with in-service requirements such as corrosive and fatigue life. Many other specifications limit stampings to 20-percent thin-out. The UTG will verify data readings.
Current practices may require the production of 20 to 200 or more tryout stampings before the potential of stamping failure becomes obvious. In contrast, the first stamping from a new die is ready to provide large quantities of data that can be turned into priceless information. The stamping is willing to talk; you need only ask. MFView Glossary of Metalforming Terms
Technologies: Quality Control
Comments
Must be logged in to post a comment. Sign in or Create an Account
There are no comments posted.
Seeking Small Victories: Continuous Process Improvement
Daniel Schaeffler September 25, 2023
 Management
Use Lean Six Sigma for Efficiency & Quality Improvement
Daniel Schaeffler Friday, October 27, 2023
 Quality Control
In-Process Inspection Software Provides Real-Time Visibility
Tuesday, March 28, 2023