


 Stuart Keeler
A Graphical Explanation of n-Value
November 1, 2016Comments
Studying the various properties of steels and other metal alloys, one property stands out as the best and most powerful: the workhardening exponent (n-value). This property, obtained from the stress-strain curve, cannot be measured as a single point, as can tensile strength. Instead, many data points from 10- to 20-percent strain in the stress-strain curve are used to develop the n-value equation. Traditional high-strength low-alloy (HSLA) steels have used this n-value since the 1970s. For these steels, n-values are mostly constant or have a narrow range. In contrast, the n-values of advanced high-strength steels (AHSS) are constantly changing and are measured and reported as the instantaneous n-value. 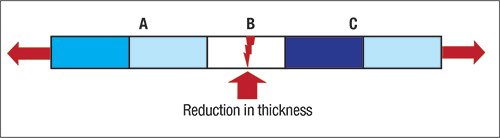
Fig. 1—Any reduction in thickness will create a higher local stress compared to other areas.
To demonstrate how important n-values are for HSLA steels, a series of graphs describes what happens after elongation of a tensile specimen (Fig. 1). This specimen is uniform along the length except for a deep scratch, gouge or some other removal of steel in area B. This material removal causes section B to have a higher stress than sections A or C. The n-value is zero along the entire strip. When the specimen reaches the yield stress, area B starts to deform—areas A and C remain constant. 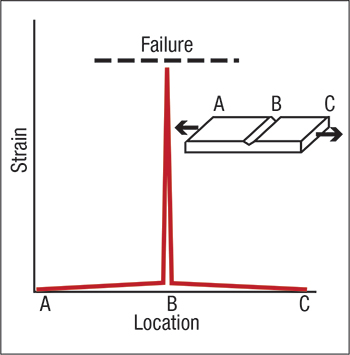
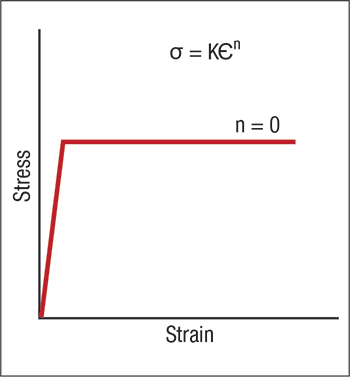
Fig. 2—A zero n-value will not increase the stress (strength) as the strain increases. Fig. 3—A deep reduction in thickness will cause strain to create a highly localized gradient and early failure. 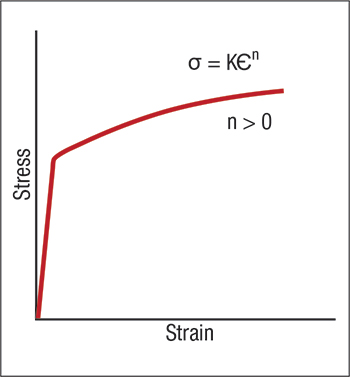
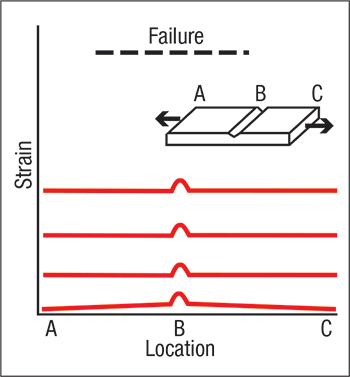
Fig. 4—The higher the n-value the faster the stress of the material will increase and avoid gradients. Fig. 5—The application of n-value to flatten strain gradients reduces the effects of any notches.
The purpose of the n-value is to increase the strength of the steel as it deforms. Fig. 2 shows that n-values of zero cause deformation to increase without any increase in stress or strength. Zones A and C do nothing because all of the deformation occurs in area B. The high concentration of deformation in area B forms a gradient—a narrow localization of strain that can reach very high peak strains (Fig. 3). Failure is easily reached.
Now assume that the entire strip has an n-value. The steel will start to workharden and increase the stress required for deformation (Fig. 4). Deformation starts at area B. After a small increase in height in area B, areas A and C start to deform and reach the strength of area B. Deformation then continues as areas A, B and C move to higher levels of strain. The higher the strain of the entire location the less importance the bump has in creating failure.
Next month, we will discuss how n-values for AHSS are quite different than those for HSLA steels. MF
View Glossary of Metalforming Terms
Technologies: Materials, Quality Control
Comments
Must be logged in to post a comment. Sign in or Create an Account
There are no comments posted. Materials
Brinell, Rockwell and Vickers Hardness Testing: Use and Misu...
Daniel Schaeffler Friday, April 1, 2022
Troubleshooting Sheet Metal Forming Problems, Part 2: The St...
Daniel Schaeffler Friday, February 26, 2021
 Quality Control
Cobot Setup Offers Pick-and-Place for Material and Product S...
Wednesday, April 29, 2020
 Video
Video  Quality Control
Tensile Testing Part 1: Equipment, Samples and Procedures
Daniel Schaeffler Wednesday, April 29, 2020