 Robert Dobrowsky
2015 Benchmarking Survey Indicates Industry Has Stabilized
April 1, 2016Comments
 The 2015 Precision Metalforming Association (PMA) Benchmarking Report for the Metalforming Industry shows that the overall health of the industry has stabilized, in the wake of a few years of strong growth. Here are some highlights from the report.
Survey Background
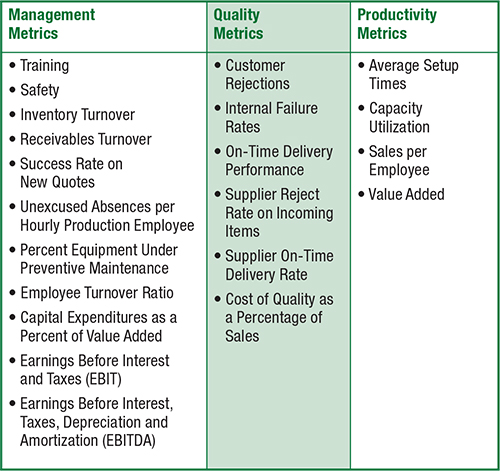
The survey helps metalforming companies measure and compare their performance against the industry average of more than 50 metrics in the areas of management, quality and productivity. Survey participants also can compare their performance against “best-in-class performers” (companies in the 90th percentile for a given metric) and the “most profitable performers” (those companies with the highest average profitability).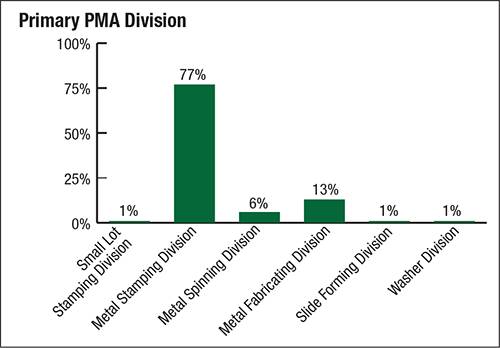 Items tracked in the survey:
• 77 percent of respondents identified themselves as metal stampers, 13 percent metal fabricators and 6 percent metal spinners.
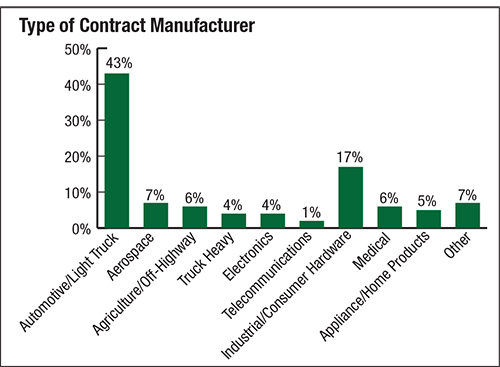
• 43 percent of respondents supply primarily the automotive industry, followed by Industrial/consumer hardware at 17 percent and aerospace at 7 percent.
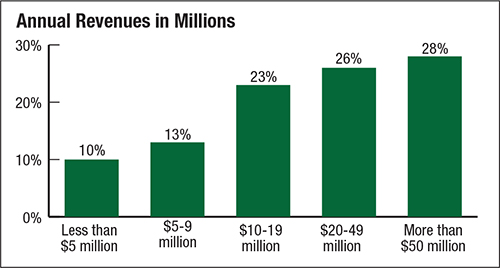
 • 28 percent of the companies included have sales exceeding $50 million, and 26 percent have sales between $20 million and $49 million.
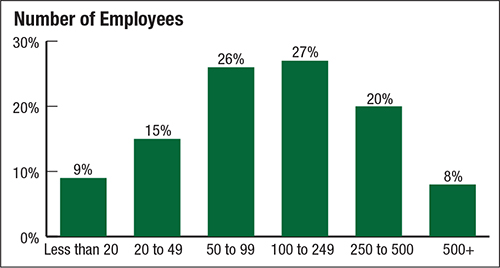
• 27 percent of survey participants have between 100 and 249 employees; 26 percent employ 50 to 100 people; and 20 percent have 250 to 500 employees.
• 84 percent of participants operate with nonunion workforces.

 Podcast
 Webinar