Level 1–Control Charting
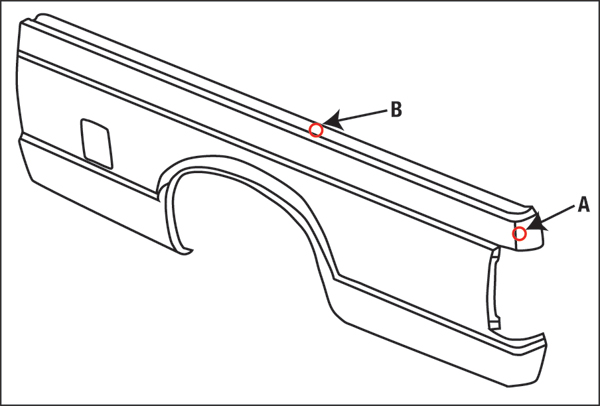 |
| Fig. 1—Templates are made to locate the UT probe to measure sheet thickness at the point of the highest severity deformation (A) and zero deformation (B). |
SPC charting and analysis form the basis of SDC. The process begins by locating the greatest forming severity in the stamping, using circle grids and forming-limit diagrams (FLDs). Next, a template (usually epoxy) is created for that location (A in Fig. 1) with a hole for the probe of a UT gauge. Thickness is measured for calculating the current forming severity. Then a second template is made for a location with zero deformation (B in Fig. 1). These two measurements generate the thickness strain at the critical location of the fully formed stamping. The ability to measure the initial undeformed thickness value allows post-mortem analysis of previous stampings, to reconstruct a severity history without premeasuring each blank. Forming severity plotted on the vertical axis of the control chart (Fig. 2) describes thickness strain. The gap between the upper and lower control limits represents stamping variability. The constancy-of-volume equation indicates that the change in thickness most likely results from a parallel increase in a tensile-strain gradient. Change in strain gradient translates into springback variations and stamping dimensional fluctuations.
Level 2–Severity Assignment
From the FLD generated in Level 1, severity bands can be assigned to the control chart from Level 1 (right side of Fig. 2). The stamping analyzed in Fig. 2 shows two excursions into the red (failure) zone and one to the top of the yellow (safety-margin) zone. The data not only confirm failure events but also the time periods during which unfavorable variables affected the stamping process.
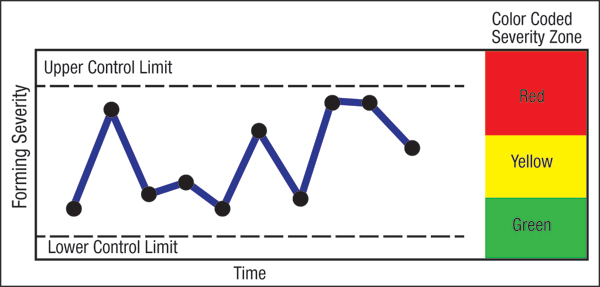 |
| Fig. 2—A control chart determines a process that is in or out of control. Data points then are assigned a forming severity—red indicates an increasing percentage of failure, and yellow the amount of safety margin. |
Level 3—Material versus Process Variability
Is the material/lubricant or the press/die causing the stamping to tear? Tests are conducted with production steel and a reference steel—a coil of steel that runs well. The tests, which comprise forming five stampings in random sequence from the production steel and the reference steel, generate data for two control charts (Fig. 3). Each data point represents the average for the five stampings, generated at specific time intervals. Sampling is stopped when a pattern becomes apparent.
Fig. 3 exemplifies two extreme cases. In case A, the variation is created by the production steel, while the press/dies cause the problem in case B. Most likely there will be some fluctuation in both the production and reference steels—tackle the source of the greatest variation first.
If the process (press/die) is the culprit, one can further narrow the source. Instead of taking measurements at the end of the production line, pull samples after the first die. If a variation exists, the first press and/or/die is the source. If both production and reference steel show no variation, remove samples after the second die. Continue down the line until revealing the source of the greatest variation. After eliminating that problem source, target the next greatest source of variation.
Level 4–Input Sensitivity
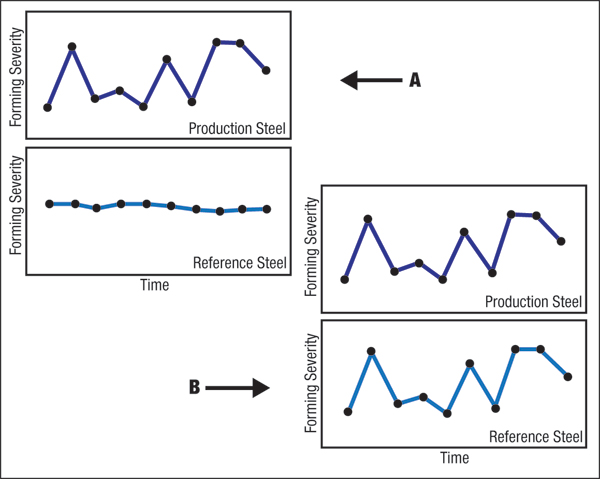 |
| Fig. 3—Data in A graphs show that variation is caused by the production steel, while B graphs reveal the process (press/die) is responsible. |
Once your engineers have identified a variable for further study, they must design a meaningful experiment. Simply forming a few blanks of variables A, B and C to see which tears less is not very informative. Instead, create a control chart for each of the three variables, which will gauge the effectiveness of each variable when all three variables run randomly during the same time period.
For more details about SDC, consult the SAE (Society of Automotive Engineers) paper 850278, entitled Statistical Deformation Control for SPQC Monitoring of Sheet Metal Forming. MF
On July18-19 in Grand Rapids, MI, Stuart will present a double seminar covering Sheetmetal 101–Understanding the Metal and Forming Sheetmetal–Understanding the Properties. Complete information can be found on www.pma.org. Industry-Related Terms: Blank,
Case,
Forming,
Gauge,
Point,
Run,
Thickness,
Ultrasonic,
Circle,
Die,
FormView Glossary of Metalforming Terms Technologies: Materials


 Stuart Keeler