5) Plot the measured major and minor strains of the ellipses (A, B, C) on the FLC curve to assign a severity rating (Fig. 2).
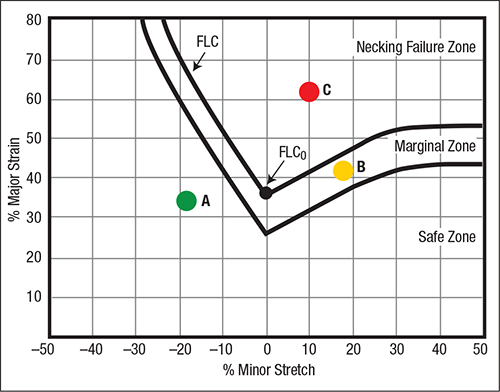 |
| Fig. 2—The FLC (upper curve) identifies the strain values at the onset of the local (through-thickness) neck. The lower curve represents the upper boundary of the green safe zone. A=safe, B=marginal, C=failure |
While this process can be time-consuming, metalformers now can employ camera/computer units that take before-and-after deformation photos of ink dots, spackle or other patterns applied to a workpiece. From these pictures, computers develop the strain information.n FLC (Fig. 2) to a thickness-strain FLC (Fig. 3). This thickness FLC also illustrates green, yellow and red zones (safe, marginal and potential for failures). Note the constant level of the FLC to the left of the centerline—this connotes that all deformation with a negative minor strain has the same thinning FLC. Those observing deformation in stampings indicate that the greatest number of failures occur in the ±10-percent minor-strain region. Stampings with larger positive minor strain not only have increased major strains but also have increased thinning without crossing into the red failure zone.
Note: Thickness strain readings can rapidly be obtained with an ultrasonic-thickness (UT) gauge, and then plotted onto graphs (such as Fig. 3) for immediate severity determination.
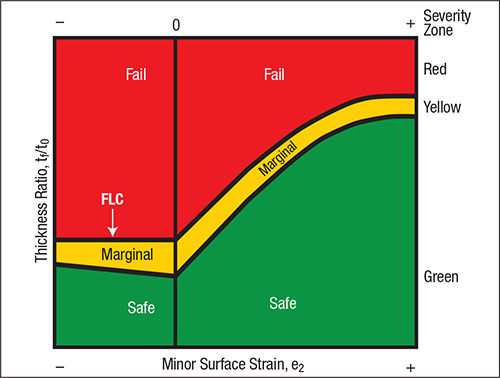 |
| Fig. 3—This graph can be calibrated from the data in Fig. 2. Note the constant FLC for negative minor strains. |
Many sheetmetal-thinning problems result from highly localized deformation called strain gradients (Fig. 4). Localized stress causes deformation to concentrate in one area that usually has a large major surface strain and a long perpendicular axis with zero minor strain. For example, consider an embossed character line. As the surface gradient grows with increasing major strain, the thickness of the gradient must decrease to comply with the constancy-of-volume rule. Often, gradients are ignored until a fracture occurs. However, the gradients easily are found in a stamping by using the UT gauge to scan potential areas. A high magnitude of thinning should alert one to a potential failure zone requiring further analysis. Why wait until failures start during a production run?
Sheetmetal bending is a little more complex. A pure bend operation will not cause any change in workpiece-material thickness. The tensile thinning of the outer surface is compensated by the compressive thickening of the inner surface, again due to the constancy-of-volume rule. Metalformers can refer to charts providing outer-fiber major strain based on the ratio of punch radius (R) to material thickness (t). Compare this value to the total elongation of the material to determine relative severity. However, many times a tensile force is applied to the ends of the bend during forming. These forces cause stretch through the full thickness of the sheet and add deformation to the outer strain, causing premature failure. The UT gauge can measure such extra thinning and add that component to the R/t stretch ratio obtained from the charts.
UT gauges in metalforming applications can:
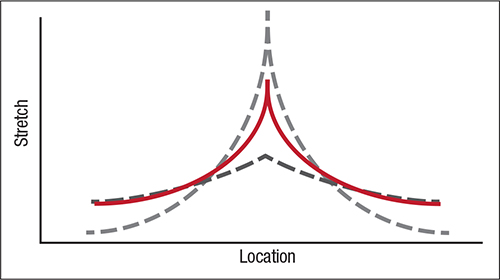 |
| Fig. 4—As stretch increases, the gradient becomes more localized in width. |
1) Deliver very short measurement times, which allow for repeat measurements for improved accuracy;
2) Read thickness to 0.0001 in.;
3) Be 10X more accurate than circle-grid strain for 0.030-in. thick material;
4) Verify die setup conditions after die transition;
5) Find any deformation changes at the end of a run to mark the die for downtime correction;
6) Monitor critical nonstable deformation areas in a stamping; and
7) Determine edge-center-edge thickness of a coil without removing the banding MF
Stuart Keeler and Peter Ulintz will speak at PMA’s Higher Strength Steel seminar on October 27-28 in Cleveland, OH.
Technologies: Quality Control


 Stuart Keeler


 Video
Video