


 Stuart Keeler
More Understanding About Work Hardening
October 1, 2009Comments
The explanation of why work hardening of most metal alloys is required for stretchability and bendability was discussed last month. One key role of work hardening is to minimize the development of strain gradients, which are highly localized peak tensile strains accompanied by localized sheetmetal thinning. A later column will show that increased work hardening usually increases the maximum allowable stretchability defined by the forming limit diagram. Work hardening is a very powerful contributor when forming in the common stretching mode.
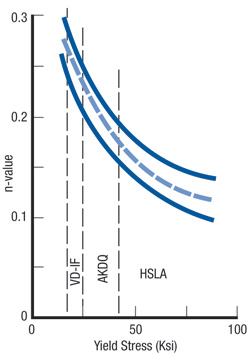 |
| Fig. 1—The n-value decreases as yield strength increases for lightly temper-passed low-carbon steels. Shown is the range of properties for three common types of steel. |
Unfortunately, the term work hardening was coined manydecades ago when the only press-shop measure of formability was the hardness test. The more the material was worked, the harder it became—thus the term work hardening. However, our understanding today of sheetmetal characteristics indicates that hardness relates primarily to the resistance to wear. The real benefit of deformation is an increase in strength of the material. Therefore, deformation really creates work strengthening. Unfortunately, to make that change in terminology would be more difficult then convincing press shops to substitute a series of tensile-test properties for current hardness readings.
One can bypass the work hardening/ work strengthening controversy by utilizing the numeric value of work hardening—the work-hardening exponent or n-value. The n-value is a measure of the slope of the stress-strain curve between the yield strength and the tensile strength. A steeper slope means more work hardening and a higher n-value. For low-carbon steels, n-value is nearly constant over the range from 10-percent strain to the end of uniform elongation (strain at the load maximum or tensile strength). This strain range and the 10- to 20-percent strain range are traditionally used by automatic tensile test computers to fit a straight regression line to determine the n-value. In addition, a quick qualitative n-value comparison between two samples can be made by comparing either the tensile strength/yield strength ratio or the uniform elongation. Higher ratios or elongations mean higher n-values. In contrast, many aluminum and brass alloys have an n-value that decreases with strain. Therefore, a reported n-value of 0.30 (0.18) means an initial n-value of 0.30 and an average n-value of 0.18.
Unfortunately, most low-carbon steels and many other alloys have n-values that decrease with increasing yield strength. The mechanisms used to strengthen the steel are the same ones that decrease the n-value. Fig. 1 shows this trend for three low-carbon steel alloys. As n-value decreases, the tendency to form sharp strain gradients increases. The maximum allowable stretchability and bendability also decrease. Fig. 1 shows that a part with insufficient stretchability (tearing) when made with the specified aluminum-killed draw-quality (AKDQ) steel most likely would have greater stretchability and an increased probability of successful forming with a vacuum-degassed interstitial-free (VD-IF) steel. Similarly, a marginal part made from 30-Ksi yield strength AKDQ steel would not be a good candidate for a running change to a 60-Ksi yield strength high-strength low-alloy (HSLA) steel.
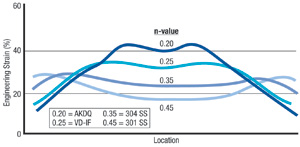 |
| Fig. 2—Strain distributions of sheetmetal stretched over a hemispherical punch. Derived from data by J. R. Newby, Sheet Metal Industries (1977). |
Fig. 2 confirms the above statements. The 0.20 n-value is an AKDQ steel and the 0.25 is VD-IF steel. The 3XX austenitic stainless steels have been called the formable high-strength steels. Published data partially confirm that claim. The curve for the 0.35 n-value is a Type 304 stainless steel and the 0.45 curve is a Type 301 stainless steel. Note that the high n-value of the two stainless steels work harden so much that no gradient is allowed to form over the head of the hemispherical punch. This forces the higher strains to form at the previous low-strain sides of the punch. Note that the strain levels are relatively flat, which makes the part more dimensionally stable and robust. In addition, the maximum strain level is decreased to create either a larger safety margin or an opportunity for greater part depth.
Forming most sheet steel has a major advantage. The overall alloy is low carbon. The temper is “O” (dead soft). A light temper pass does not change the temper. This designation covers a tremendous tonnage of the steel being formed. For this reason, steel has been a topic of much research and many press-shop studies. General property trends have been identified that allow prediction of one property from another. Fig. 1 is a property relationship generated from all low-carbon O-temper steels.
In contrast, aluminum, copper, brass and many other nonferrous metals each have an extensive number of alloys, types and tempers. Each combination has its own set of relationships, but production volume is much smaller than steel. Property data (especially nonconstant n-values) are hard to find and general trends are even more rare. However, the n-value is at least, if not more, important for these nonferrous alloys than with steel. All n-values still control strain distribution and maximum allowable stretch defined by the forming limit diagram—key parameters in making a successful part. MF
View Glossary of Metalforming Terms
Technologies: Quality Control
Comments
Must be logged in to post a comment. Sign in or Create an Account
There are no comments posted.
Brinell, Rockwell and Vickers Hardness Testing: Use and Misu...
Daniel Schaeffler Friday, April 1, 2022
 Quality Control
Troubleshooting Sheet Metal Forming Problems, Part 2: The St...
Daniel Schaeffler Friday, February 26, 2021
 Quality Control
Cobot Setup Offers Pick-and-Place for Material and Product S...
Wednesday, April 29, 2020
 Video
Video